
Milan Kloewer
A 7-day weather forecasts is now as accurate as a 5-day forecast 20 years ago, thanks to faster supercomputers and decades of scientific weather forecast model development. However, there is still a widespread public misbelief that forecasts are not reliable. Traditional weather forecasts rarely contain information about the reliability and a paradigm exists where a layperson is not expected to understand forecast uncertainty. Especially smartphone weather apps tend to present forecasts in an overly simplistic way that may support the aforementioned little public confidence in weather forecasting.
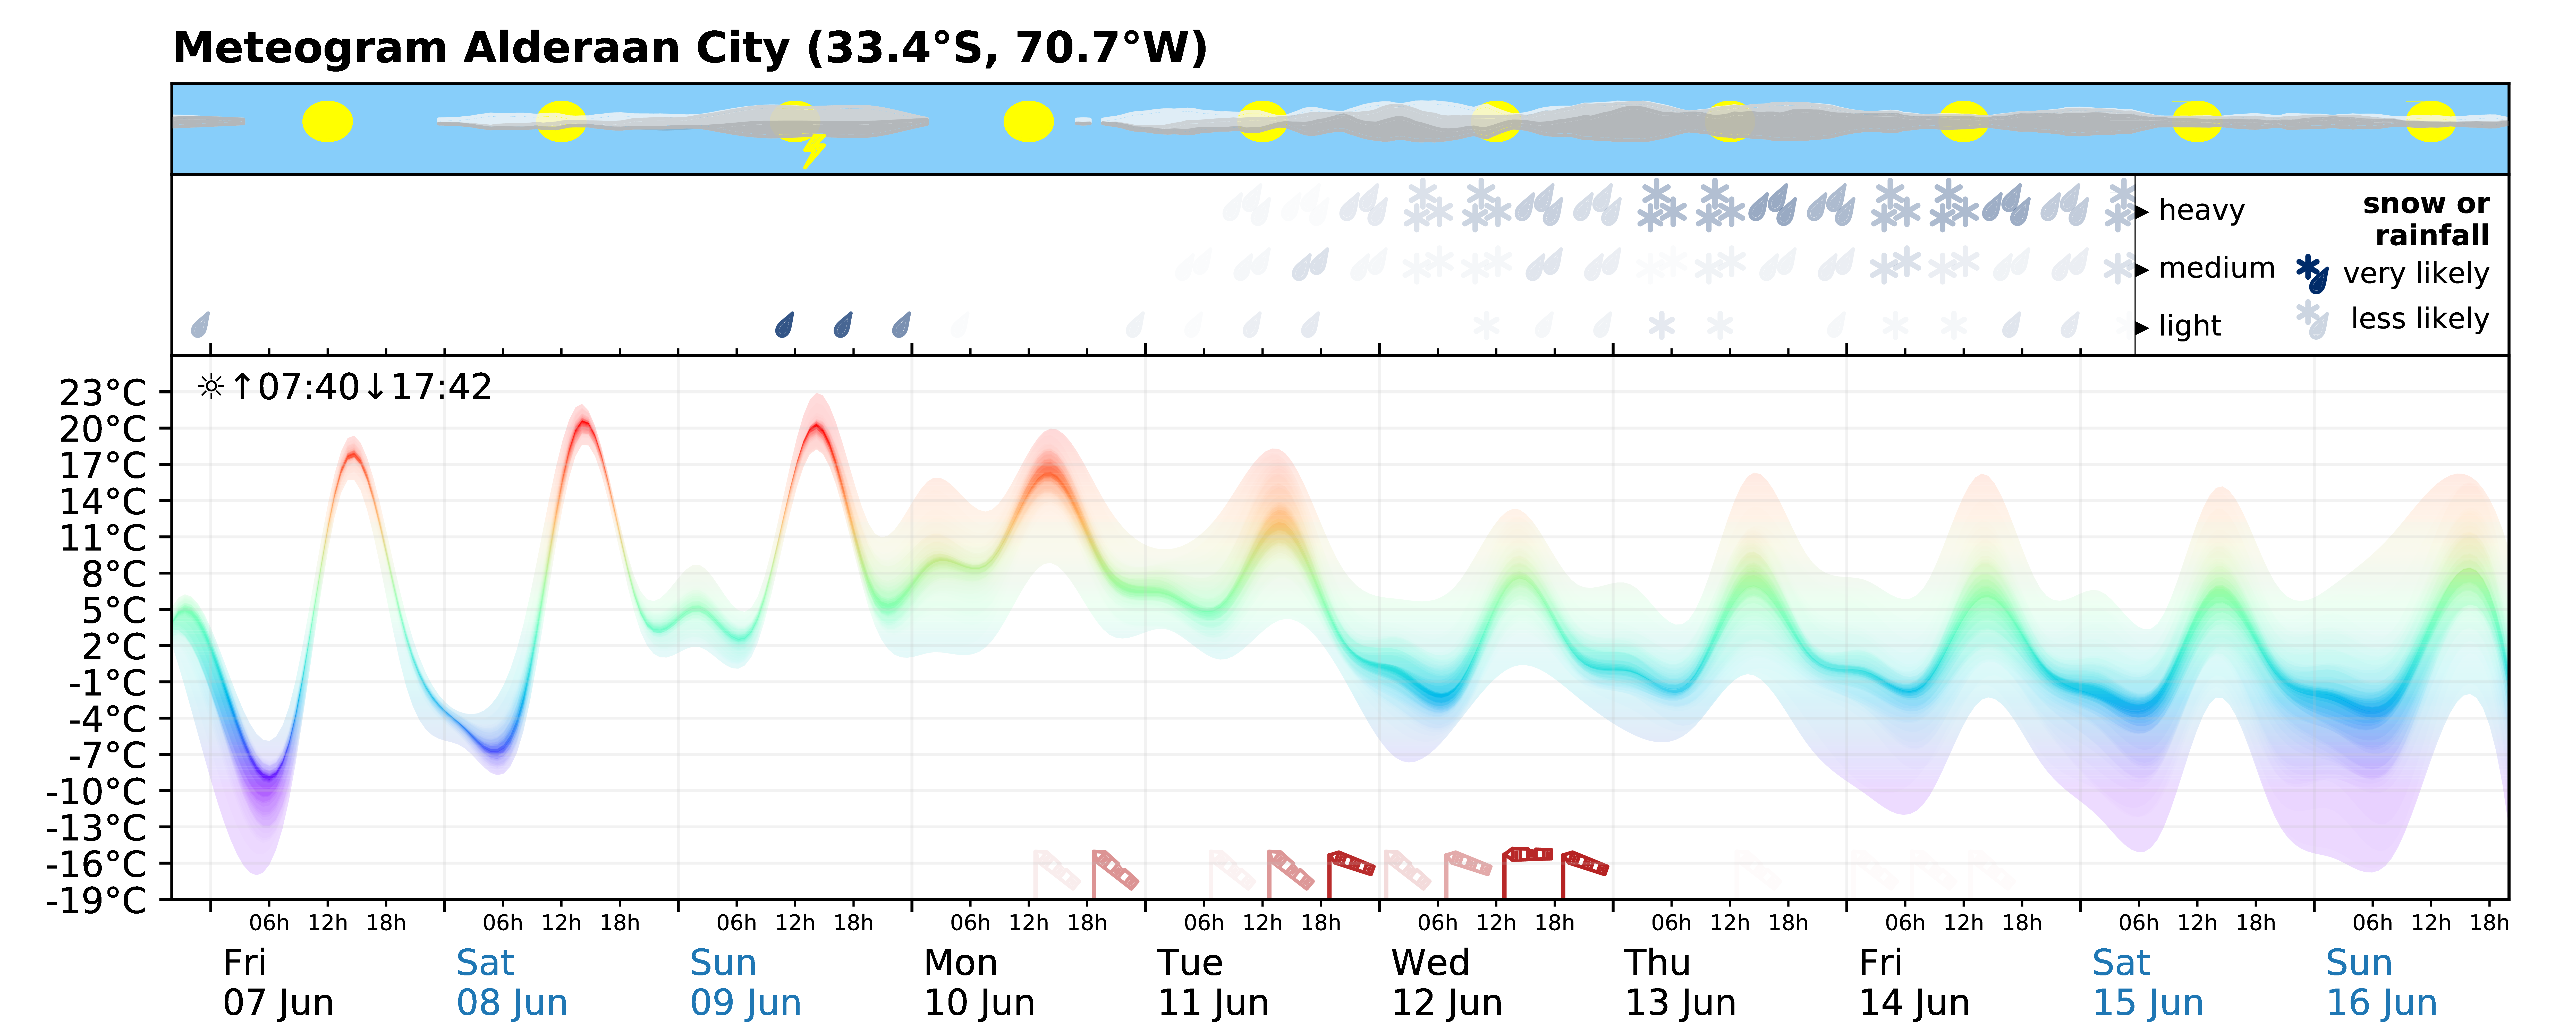
The proposed solution is an intuitive way of visualizing the probabilistic information of an ensemble forecast in the form of a meteogram, summarizing the weather for a given location throughout the next week, as this is of large public interested. The meteogram is designed to be easily understandable for everyone without a statistics background. The temperature is plotted as a colour-shaded time series, where width and transparency denote the uncertainty and colour is used to provide an intuitive feeling for the temperature (blue=cold, red=warm). Strong winds can be seen on the bottom of that panel, where a windsock indicates the expected strength. Transparency denotes the uncertainty of the wind forecast. The upper panels provide information about cloudiness and precipitation. Rain and snow are split into three categories: light, medium and heavy that are displayed in three rows, each with transparency to denote the uncertainty of a rainfall event at a given strength. In case of snow, the rain droplets are changed into snow flakes. The precipitation panel therefore can display events like “very likely weak rain, but unlikely stronger” or “equally likely medium or heavy rain”. Cloudiness is presented in the top panel, indicating clouds at low, medium and high altitudes in different shades of grey. The thickness represents the cloud cover of each level. Additionally, a lightning bolt may indicate once the chance of thunder is beyond a given threshold. Sunrise and sunset times are provided in the temperature panel.
The weather forecast for Alderaan City shows warm temperatures during the day around 20°C for the next days, although nights are cold. Weak rain and thunder has to be expected on Sunday. Monday will be the most beautiful day of the week with low cloud cover and temperatures around 14°C. During the week, temperatures are expected to drop and uncertainty increases towards the next weekend. Strong winds have to be expected for Monday, Tuesday and Wednesday, that will peak on Wednesday noon. Probably strong rainfall from Tue onwards, increasing in likelihood and strength towards Thursday and Friday. Full cloud cover throughout the week, but thinner on the next weekend.
We believe that the additional information about the uncertainty of a forecast will increase public confidence in weather forecasting, important for a wider outreach of publicly funded data.
—
Notes on data used: Due to licensing and size issues, we cannot provide the ensemble prediction data from the European Centre for Medium-Range Weather Forecasts (ECMWF, Reading, UK) directly. However, many meteogram examples of current forecasts can be found in the repository (github.com/milankl/prob_meteogram/examples). In order to present a meteogram that contains all features (wind, extreme temperatures, rain, snow, thunder, clear sky as well as clouds) within a single week, we have faked data for a fake location, that is available in the repository.