Gytis Dudas, Luiz Max Carvalho, Trevor Bedford, Andrew J Tatem, Marc A Suchard, Philippe Lemey, Andrew Rambaut
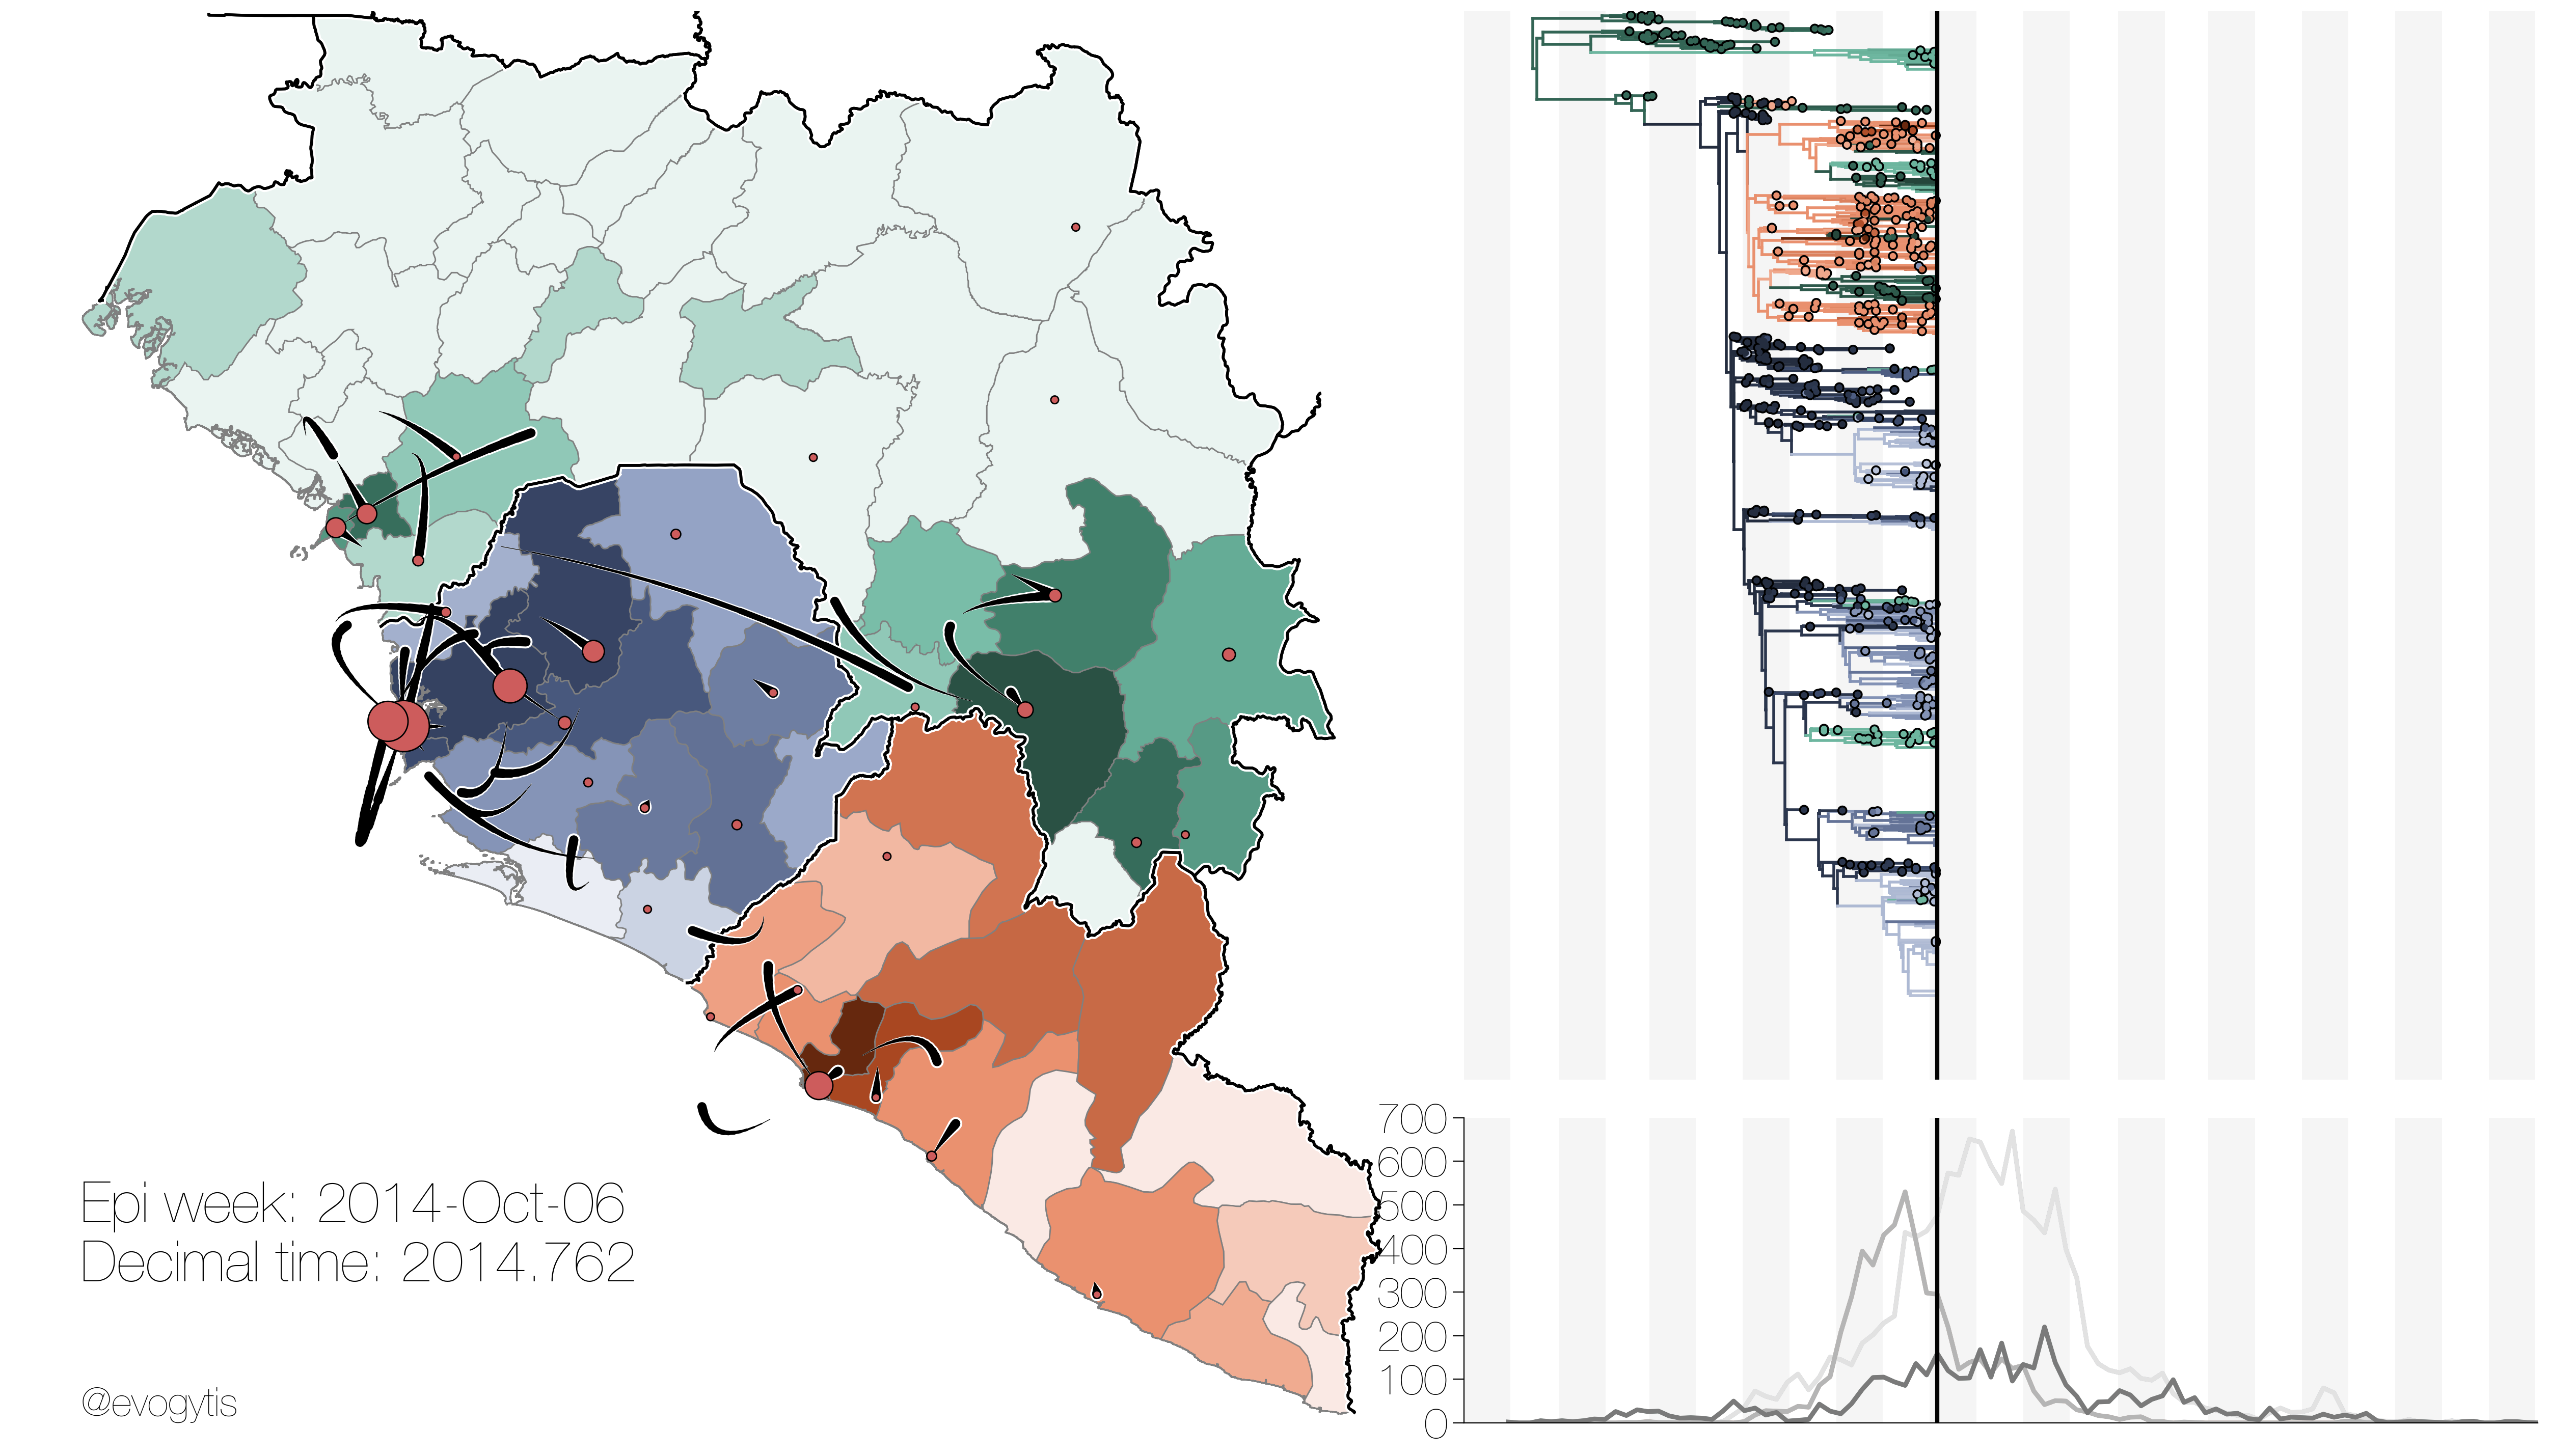
The Ebola virus disease epidemic in West Africa has been unprecedented in its magnitude and duration. Over 1600 genomes of Ebola virus, representing over 5% of all known cases, have been sequenced by numerous groups operating across the three most affected countries: Guinea (green), Sierra Leone (blue), and Liberia (red). We used these genomes, as well as the information about when and where they were collected, to infer the evolutionary history (phylogeny) of the epidemic (upper right). Phylogenetic tree branches are coloured by country (red, blue and green) and by inferred administrative division (lighter colour indicating westerly areas).
The map (left) shows migrations inferred in the phylogeny as “missiles”, coloured black if Ebola virus is moving within the same country, or by origin colour if a lineage is moving internationally. Reported weekly new cases for each administrative division in the map is represented by the polygon’s colour intensity, with large numbers of new cases shown as darker colours.
A plot of new weekly cases reported by each country is shown in lower right, coloured by country (Sierra Leone is blue, Liberia is red, Guinea is green). At the height of the epidemic Sierra Leone (blue) was reporting ~700 new cases per week.
Viral migration played a key role in the severity of the Ebola epidemic that can be seen in the animation. An early migration occurring in March/April 2014 from Guinea (green) into neighbouring Sierra Leone (blue) gave rise to a lineage that caused the vast majority of cases. Following this introduction the virus raced rapidly westwards across Sierra Leone (blue) towards Freetown, but also spread into nearby Liberia (red), causing a large outbreak centered on Monrovia. During summer of 2014 Guinea (green) also suffered from multiple back-spillover events, where viruses from both Liberia (red) and Sierra Leone (blue) were re-introduced into Guinea (green). As the epidemic subsided in early 2015 a clear region of continued transmission developed on the border of Sierra Leone (blue) and Guinea (green), caused by rapidly migrating transmission chains frequently hopping across country borders.
The study was published here: https://www.nature.com/articles/nature22040, open-access version available here: https://www.biorxiv.org/content/early/2016/09/02/071779. Nearly all figures were done in matplotlib, with code available here: https://github.com/ebov/space-time/tree/master/Scripts/notebooks. Animation frames were rendered in matplotlib using this notebook: https://github.com/ebov/space-time/blob/master/Scripts/notebooks/EBOV_phylogeography_animation.ipynb.
Code and data: 1


